
Funding Rate Signals: A Practical Playbook for Reading Market Sentiment and Managing Risk
How Funding Rates Expose Crowd Sentiment and Warn Traders Before Market Reversals

TL; DR
Funding rates are the crypto market’s early warning system. They show when traders are too bullish or too bearish, and often flash signals before major reversals or crashes.
Perpetual futures depend on funding to stay in line with spot prices. When too many traders go long, they pay shorts; when too many go short, they pay longs. It’s how exchanges keep prices balanced.
Extreme funding means extreme sentiment. Persistently high positive rates suggest greed and overconfidence; deeply negative rates reveal fear and capitulation.
Use funding alongside other data. Combine it with open interest and liquidation info to spot overheated markets or potential bottoms with more accuracy.
Treat funding as a risk indicator, not a signal. High funding means risk is rising, not that prices will drop immediately. It’s a gauge of crowd emotion, not direction.
Make funding checks part of your routine. Monitor daily, set alerts, and journal patterns. Over time, you’ll learn to spot danger before most traders do.
The Hidden Signals Before Every Crash
Every time crypto prices surge, there’s a moment when markets feel unstoppable. Everyone’s convinced the price will “never go down again,” and social media explodes with hype. Then, out of nowhere, there is a sudden crash. Prices drop fast, and traders who borrowed money to trade bigger lose everything.
These crashes always seem to come “out of nowhere.” But they don’t. There are warning signs. And one of the clearest clues is something most traders overlook, which is funding rates.
Funding rates might sound technical, but they are actually one of the simplest and most powerful metrics you can use to understand market mood, spot potential reversals, and protect yourself from certain traps. If you want to start trading crypto perpetual futures, ignoring funding rates is dangerous. It’s like ignoring the warning lights on your car dashboard.
This playbook is designed to change that. By the end, you’ll know exactly what funding rates are, why they matter, how to read them, and how to use them to make smarter, safer trading decisions, even if you’re brand new to perps.
What Are Funding Rates, Really?
When you trade perpetual futures contracts, you’re trading contracts that don’t expire. That’s what makes them different from traditional futures. But that freedom creates a problem: without an expiry date, how does the contract’s price stay close to the real (spot) market price? Enter funding rates: the mechanism that keeps things in balance.
Funding rates are small payments traders make to each other every eight hours.
When too many traders go long, the perp price tends to drift above spot, so longs pay shorts a funding fee.
When too many traders go short, the perp price falls below spot, then shorts pay longs.
This back-and-forth acts as a self-correcting system. It keeps prices tethered to reality and reveals where traders are leaning too heavily.
You can think of funding rates as the market’s heartbeat, steady when balanced, racing when sentiment runs hot.
For a quick intro, you can check out Funding Rates 101 from CoinTelegraph.
Why Funding Rates Reveal Market Mood
Funding rates tell you what traders believe, in real time.
When funding turns positive, it means longs are paying shorts. Traders expect higher prices, so they’re willing to pay to stay long. But when positive funding gets extreme, it’s a warning: too many traders are betting the same way.
When funding turns negative, shorts are paying longs. The market expects lower prices. But when that pessimism becomes overwhelming, it often marks the bottom of fear, the moment when most traders have already sold or shorted.
Scenario 1:
In April 2021, Bitcoin’s funding rates on major exchanges spiked to some of their highest levels on record, with Binance perpetuals showing extreme positive funding, signalling euphoric long positioning.
According to CoinGlass historical funding data, traders were paying annualized rates exceeding 150% to hold longs, a sign of overheated sentiment that preceded a sharp 15% price correction and billions in liquidations within days.
Scenario 2:
In June 2022, Bitcoin’s funding rates across major exchanges stayed deeply negative for several days, reflecting widespread panic as prices plunged toward $17,000.
Data from CoinGlass negative funding rate charts shows traders paying heavy premiums to hold short positions, a classic sign of capitulation that preceded a period of price stabilization and rebound soon after.
Funding rates are emotional data in numeric form. When they’re calm, markets are balanced. When they swing wildly, emotion is taking control, and that’s when smart traders prepare, not react.
How to Actually Read Funding Rates
You don’t need a PhD in finance to interpret funding rates. Here’s what you really need to know:
When funding rates are slightly positive or negative, the market is balanced.
When funding rates become extremely positive, it means everyone’s long and confident, often too confident.
When rates go deeply negative, traders are fearful and overloaded on shorts, often near market bottoms.
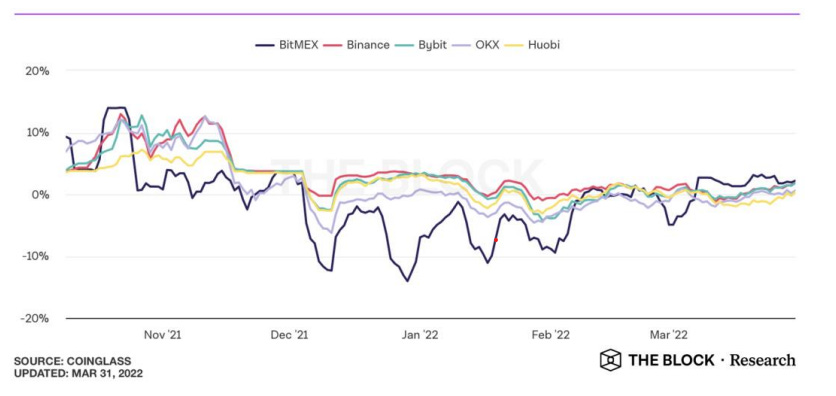
Most tools list funding rates for every major crypto perpetual contract. For instance, CoinGlass Funding Rate Tracker compares rates across exchanges and helps you see where liquidation risk in crypto derivatives is rising.
When rates spike together across exchanges, the market is often nearing a sentiment extreme.
Combining Funding Rates With Other Market Data
Funding rates alone are useful, but they become far more powerful when you combine them with other signals like open interest and liquidations.
For instance:
If funding rates are rising and open interest is climbing, that usually means traders are opening more long positions with leverage.
If funding rates stay high while prices move sideways, it means the market’s overextended. A sharp correction could be near.
If funding rates turn deeply negative while open interest falls, traders are closing shorts, that’s often the start of a recovery.
You can see all these metrics together on tools like CanHav’s own research SaaS (beta). We visualize funding, open interest, and liquidations on one screen, helping you detect overheated leverage setups before they unravel.
Read more on how open interest shapes market behavior in our full CanHav Research guide.
Avoiding Common Leverage Traps
The biggest mistake new traders make is assuming high funding rates mean strength. They don’t. They mean the market’s already stretched.
Leverage accelerates both gains and losses. When funding rates climb, it’s a clue that traders are borrowing heavily to stay in winning positions. If price suddenly dips, all those leveraged trades can get liquidated in seconds, triggering what’s known as a liquidation cascade, where forced selling drives prices down even faster.
In these moments, liquidation chains can ripple across exchanges and amplify volatility, a dynamic explored in systemic risks of liquidation cascades. As the Yield App research on cascading liquidations in crypto markets notes, even small leverage imbalances can snowball into major market drawdowns once automated liquidations kick in.
The best defense is awareness. You don’t have to stop trading perps, but you do need to watch the cost of staying in them. A funding rate above +0.1% (or below -0.1%) every eight hours should raise your eyebrows. It’s a sign that emotion, not logic, is driving positioning.
For traders who want to stay proactive, anticipating volatile moves via liquidation data can help identify when leverage risk is building up before it spills over into sharp price swings.
Most analytics tools let you set alerts, so you’ll know when funding rates cross dangerous levels. Think of these alerts as your trading radar. They won’t predict a crash, but they’ll warn you when risk is rising fast.
How to Use Funding Rates in Your Trading Routine
Learning about funding rates is one thing. Using them effectively in real trading is another. You don’t need complicated formulas or paid data feeds to make funding rates part of your trading process. You just need consistency, a bit of structure, and an understanding of what each signal means in practice.
Here’s a step-by-step framework you can start using right now:
1. Start Every Trading Day by Checking Funding Rates
Before opening any position, especially a leveraged one, spend five minutes checking current funding rates on a reliable tracker like Coinglass.
Look across multiple exchanges to see whether rates are generally positive or negative. If every major exchange shows high positive funding, it means longs dominate, and the risk of a correction is rising.
Tip: Add funding rates as a bookmark or widget on your browser. Treat it like checking the weather before you go outside. You wouldn’t skip it if you knew a storm was coming.
2. Set Clear Funding Rate Thresholds
For novice traders, it helps to create simple “if-this-then-that” rules around funding.
Here’s a good starting framework:
If funding > +0.1% every 8 hours: Market is overheated. Avoid opening new long positions or consider hedging.
If funding between -0.05% and +0.05%: Market is balanced and it is safer to trade normally.
If funding < -0.1% every 8 hours: Market is overly bearish. Look for long opportunities or prepare for potential rebounds.
These thresholds aren’t absolute, each market behaves differently, but they’ll help you avoid trading emotionally.
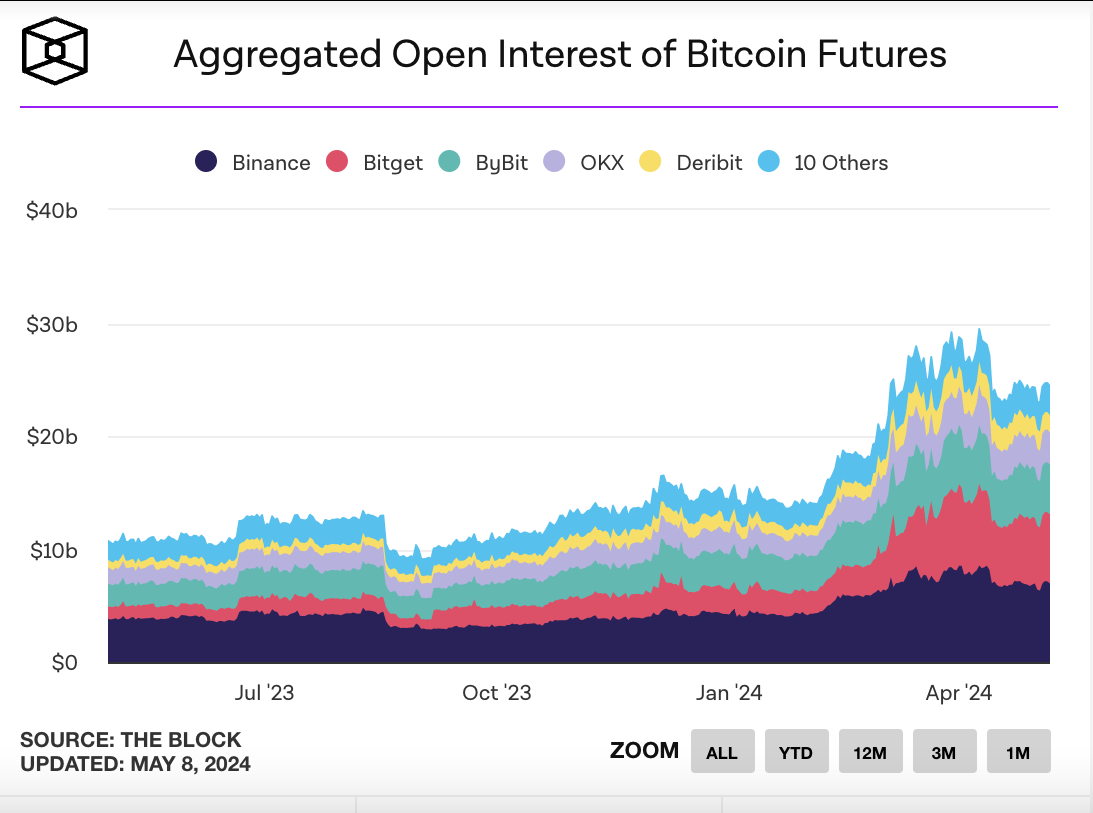
A recent CanHav analysis found that open interest reached a new all-time high even as funding remained elevated, signaling an overheated market driven more by leverage than organic demand. For traders, spotting these divergences early can make the difference between taking profits and getting caught in a cascade.
3. Combine Funding Rates with Other Market Data
Funding rates work best when they’re part of a bigger picture. Before entering a trade, check:
Open Interest: Is it climbing (more traders entering positions) or falling (positions closing)?
Liquidations: Are we seeing waves of forced selling or buying?
Price Action: Is the market trending or ranging?
If funding is positive and open interest is rising fast, the market’s likely overleveraged. That’s not when you want to FOMO in. You can track all three metrics side by side on Coinalyze or Laevitas.
4. Use Alerts to Stay Ahead of Extreme Conditions
You don’t have to manually monitor funding all day. Most tools let you set alerts that trigger when funding rates cross certain levels.
For example:
Alert me if BTC perpetual funding > 0.12%
Alert me if ETH perpetual funding < -0.10%
That way, you’ll be notified before volatility hits, not after. This is especially helpful if you’re working full-time or trading part-time.
5. Track and Journal Funding Trends
Trading is part skill, part memory. Start recording funding rates in your trading journal. Even noting the general sentiment (“funding very positive, everyone bullish”) alongside your trades helps you see patterns over time.
You’ll start to notice recurring setups, like how extreme funding often precedes pullbacks, or how negative funding tends to coincide with bottoming phases.
Tools like Notion or Edgewonk make it easy to log these metrics with your trade entries.
6. Treat Funding Rates as Risk Indicators, Not Signals
Here’s the mindset shift that separates disciplined traders from emotional ones: Funding rates don’t tell you what to trade, they tell you how much risk is already in the market.
When funding spikes, it’s not an invitation to short; it’s a reminder that the crowd’s overexposed. When funding crashes, it’s not a “buy now” signal; it’s a sign that fear has likely gone too far.
In other words, funding rates don’t predict, they warn.
The smartest traders treat them like radar, a background awareness system that lets you sense turbulence before it hits.
7. Review and Adapt Weekly
At the end of each week, look back at how funding behaved versus price action. Did spikes in funding precede major moves? Did negative funding align with reversals?
This reflective practice transforms data into intuition. Over time, you’ll start to “feel” when the market’s crowded long before the metrics confirm it.
Conclusion: Learn the Market’s Language
Funding rates are the market’s emotional translation into numbers. They tell you when traders are euphoric, fearful, or just balanced, and learning to read them turns chaos into structure.
For beginners, this is your first real edge. You’re not predicting the future; you’re understanding how the crowd feels about it.
The next time you see prices climbing non-stop and social media screaming “to the moon,” check the funding rate. If it’s flashing red, step back. The market is warning you, not with words, but with data.
Because in leveraged markets, the loudest emotion usually marks the quiet start of reversal.
Subscribe to CanHav on crypto trends, derivatives, stablecoin strategies, and on-chain finance. Get alerts on 2026 updates!
Disclaimer: This article is for informational purposes only. It does not constitute financial advice, a recommendation to buy, sell, or hold any asset, or an endorsement of any specific strategy. The crypto market is highly volatile and risky. Always do your own research (DYOR) and never invest more than you can afford to lose.
Love this perspective; what if the 'crowd emotion' reflected in fundin rates is less a spontaneous market sentiment and more a condition actively exploited by large players, making the risk indicator a roadmap for their next move?