
Open Interest (OI): A Research Guide to Predicting Crypto Big Moves
Navigate the crypto markets with more clarity. We break down advanced concepts into easy lessons and actionable ideas.

TL; DR:
Open Interest (OI) is a powerful tool that helps you spot when big price moves might be coming in the crypto market.
It’s not just about counting how many trading contracts exist, but understanding why they’re there, and what that says about how traders are feeling.
Once you know how to read OI, you’ll have a clearer idea of when the market’s energy is picking up or slowing down, so you can prepare before major price swings happen.
This article will explain OI in simple terms, show you how to use it in your own trades, and share practical tips to navigate crypto’s ups and downs with more confidence.
Unlocking the Power of Open Interest
Navigating the crypto markets can feel overwhelming. Prices swing wildly, headlines change every hour, and it’s hard to know what’s really driving the next move. But there’s one powerful metric that can help you spot big market shifts before they happen, and that’s Open Interest (OI).
As Investopedia explains, Open Interest is the total number of active futures or options contracts that haven’t been closed yet. In simple terms, it shows how much money and leverage is currently tied up in the market.
Think of OI as an early warning system. It measures how many open bets are still live, helping you understand what traders are doing, whether they’re piling in, taking profits, or backing off. When OI suddenly spikes or drops, it can hint that volatility is coming, which is exactly what experienced traders look for.
Tracking OI alongside price action gives you a clearer picture of what’s really happening under the surface, helping you spot breakouts or breakdowns before they become obvious.
In this article, we’ll cut through the complexity and show you how to interpret Open Interest like a pro, giving you a data-driven edge to make smarter, more confident crypto trading decisions.
What Exactly is Open Interest (OI)?
Open Interest shows how many contracts are still open in the market, meaning they haven’t been closed, settled, or expired yet.
The Party Analogy: Understanding OI
Imagine the market is a party:
OI increases when new people arrive.
Every time a new buyer and seller open a trade, two new guests join the party. The crowd gets bigger and the market is becoming more active.OI decreases when people leave.
When two traders close their trade, they leave the party and OI goes down.OI also decreases when the party ends.
When a contract expires or settles, those traders are done, just like everyone going home when the party’s over.
This analogy makes it clear that OI grows when traders are opening positions and shrinks when they’re closing them.
Keeping an eye on OI helps you see whether new money is entering the market or existing positions are winding down.
The Key Difference: OI vs. Volume
It’s easy to mix up Open Interest with Trading Volume, but they measure very different things.
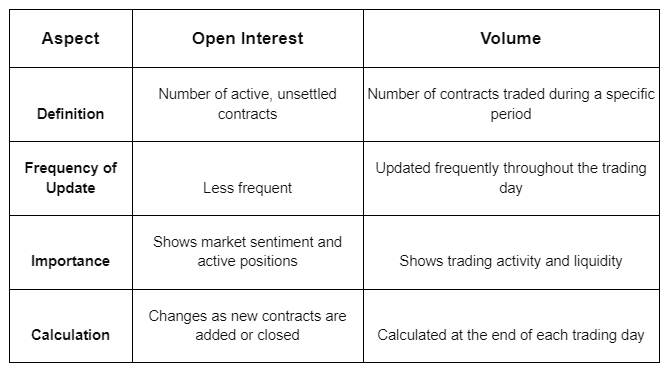
You can have high trading volume but low OI, like a busy party where people keep coming and going quickly. Or low volume but high OI, where fewer traders are active, but they’re holding their positions longer.
Understanding how OI and volume interact helps you spot when the market is heating up or cooling down, often before prices move.
How High Open Interest Fuels Massive Price Moves
Now let’s connect OI with another powerful concept - leverage.
When Open Interest gets very high, it often means a lot of traders are using borrowed money (leverage) to take positions. That’s when the market becomes like a coiled spring, full of potential energy that can release suddenly.
When prices move sharply and traders start getting liquidated (forced to close losing positions), that energy is released, causing big, fast price swings (We’ll cover liquidations in-depth in a future article).
If you are new to derivatives, think of leverage as a loan that lets you control a much larger position with a small amount of money. It can amplify profits, but also losses.
Resources from the Commodity Futures Trading Commission (CFTC) and Bank for International Settlements (BIS) explain how leverage can make the entire market more unstable.
The Domino Effect of Liquidations
Here’s where things can snowball fast.
In leveraged trading, if prices move against your position and your margin (your own money in the trade) runs out, the exchange automatically closes your trade to prevent you from losing more than you have. This is called a liquidation.
When a lot of traders get liquidated at once, it triggers a chain reaction. One liquidation causes selling, which pushes the price down, which triggers even more liquidations.
Example:
Let’s say Bitcoin is trading at $60,000, and OI is at an all-time high. Around 80% of traders are long (betting on higher prices). If Bitcoin drops to $58,000, thousands of those leveraged positions can’t meet margin requirements. Exchanges start selling automatically, pushing prices even lower.
This forced selling can quickly snowball, creating a domino effect that drives prices down faster and harder.
The Liquidation Cascade: When One Fall Knocks Over the Rest
Each liquidation adds fuel to the fire. One trader’s forced sale lowers the price just enough to liquidate the next trader, and so on.
This chain reaction is known as a liquidation cascade, a rapid series of forced sell-offs that can turn a small dip into a full-on crash.
This domino effect isn’t new. A report from the Federal Reserve Bank of Chicago, “The Mechanics of Margin Calls,” shows this same process has driven sell-offs in stock and futures markets for decades.
Example:
Bitcoin drops from $60,000 to $58,000, triggering the first liquidations. The price then falls to $57,500, which triggers more. Soon it’s at $56,800, a 15% crash caused entirely by automatic sell orders.
You can actually watch these liquidation waves unfold in real-time on data sites like CoinGlass Liquidation Data. It’s a great way to see how tightly leverage, OI, and volatility are connected.
How Leverage Turns a Spark into a Wildfire
Leverage is like adding gasoline to a small fire. It makes everything more intense.
The higher the leverage, the smaller the price move needed to wipe out a position. For example, with 100x leverage, just a 1% price move against you can cause a liquidation.
When many traders use high leverage in a market with high OI, the system becomes fragile. Even a small market wobble can trigger huge price swings, what traders call a “cascade.”
High OI tells you how much fuel is sitting in the market. If it’s paired with extreme leverage, you can expect volatility. But when OI drops after a big move, it often means the market has cleared out, setting the stage for a calmer phase or a rebound.
The CFA Institute explains this well. Leverage can make good trades great, but it can also turn small mistakes into big losses if not managed carefully.
The Four Predictive Signals Every Trader Should Know
Now that you understand what Open Interest (OI) is, let’s look at how you can actually use it to make smarter trading decisions.
By watching how price and OI move together, you can often see where the market’s energy is building, and where it might be running out of steam.
These four signals are used by traders across both crypto and traditional futures markets (as explained in CME Group’s learning center and the CFTC’s guide to derivatives).
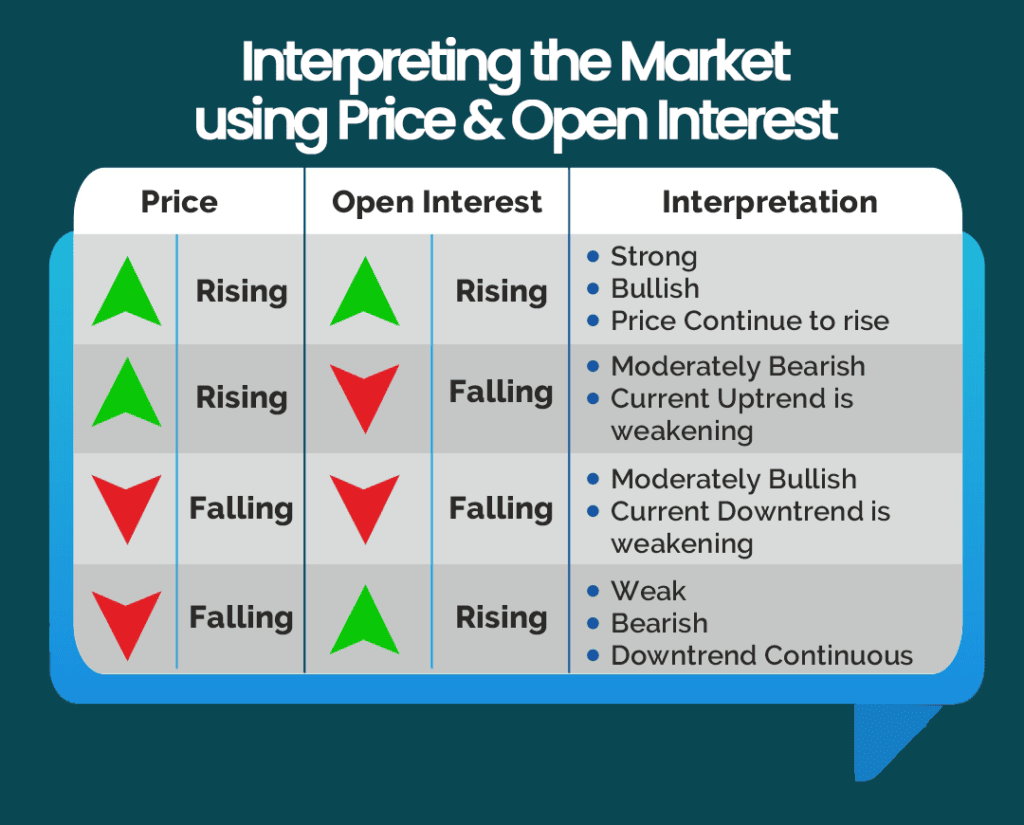
Here’s your breakdown of the cheat sheet:
Signal 1: The Conviction Move (Healthy trend - Price Up + OI Up)
This is a healthy sign of a strong uptrend. When both price and OI rise together, it means new money is flowing in. Traders are opening new long positions because they believe in the rally, and they’re putting real capital behind that belief.
In simple terms:
The market is going up and more people are joining the party. That’s momentum with conviction.
What to Do:
This usually confirms the trend’s strength.
You could consider staying in your long position or even adding to it, but always with good risk management.
Example:
Ethereum jumps from $2,500 to $2,800, while its Open Interest rises 25%. This shows that new buyers are entering the market, not just traders recycling old positions. The move is more likely to continue because it’s fueled by fresh demand.
Signal 2: The Bearish Onslaught (Strong downtrend - Price Down + OI Up)
When prices are dropping but OI keeps climbing, it means traders are opening new short positions, betting the market will fall further. This often signals that bearish momentum is strengthening.
You can think of it like more people jumping on the “downward train,” adding pressure as it picks up speed.
What to Do:
This confirms a strong downtrend.
Avoid buying too early. It’s like trying to catch a falling knife.
Wait for signs that the selling pressure is cooling down before re-entering.
Example:
Bitcoin falls from $70,000 to $67,000, but OI rises steadily. That means more traders are shorting the market, adding fuel to the fall. Historically, similar setups have preceded deeper corrections (see analysis from the Bank for International Settlements).
Signal 3: The Bull Trap (Weak Rally - Price Up + OI Down)
When prices rise but OI falls, it’s a warning flag. The rally may look strong, but behind the scenes, traders are actually closing positions, taking profits or exiting shorts.
It means the move is running on fumes, not real conviction.
In simple terms:
The market is going up, but fewer people are still in the game.
What to Do:
Be cautious.
This is often a sign to take profits or tighten your stop-loss.
Avoid chasing the move higher.
Example:
A memecoin jumps 50% in a single day, but OI drops 15%. That means short-term traders are closing out their bets and taking gains. This type of rally, sometimes called a “sucker’s rally”, often reverses just as fast as it rose.
For context, studies from the European Central Bank have found that short-lived speculative spikes often share these same signs, high prices with falling OI.
Signal 4: The Capitulation Climax (Reversal signal - Price Down + OI Down)
This signal appears at the end of a sharp sell-off. Both price and OI are falling, meaning positions are being closed, traders are giving up, locking in profits, or getting liquidated.
This is known as capitulation, when everyone who’s going to sell has already sold.
In simple terms:
The panic selling is ending, and the market is finally starting to calm down.
What to Do:
Watch closely for signs of a bottom, like slowing volume or prices stabilizing.
It might soon be time for a relief rally or bounce.
Example:
After a 20% crash, Solana keeps falling slightly, but OI drops fast. That’s a clue the liquidation cascade is ending. Shorts are closing out, and the market is resetting, often just before a short-term recovery.
For a deeper explanation, the Bank of England describes how this pattern often marks the “exhaustion phase” of a selloff in both traditional and digital markets.
Example Use Case Scenario: The Bitcoin Squeeze
Let’s imagine this scenario for Bitcoin:
Situation:
Bitcoin has been in a strong uptrend for several weeks, and the price just pushed above $40,000. Traders across exchanges are feeling confident, and social media is full of bullish sentiment.
If you check sites, you’ll see that the market’s Open Interest (OI), the number of active contracts, has been rising during this rally.
OI Observation:
The data shows that Open Interest for Bitcoin futures has climbed sharply as the price moved higher.
A large chunk of this OI is sitting around the $40,000-$42,000 zone, which tells you that many traders have opened long positions (bets that the price will go up).
Most of these positions are leveraged, meaning traders are using borrowed funds to control bigger trades with smaller deposits.
If you’re new to leverage, think of it like using a small down payment to control a big house, great when prices rise, risky when they fall. You can learn more about leverage basics from the CFA Institute and CME Group’s Futures Education.
Analysis:
When Open Interest is high and most traders are on the same side (in this case, long), it means there’s a lot of built-up risk in the system.
If Bitcoin’s price stops climbing or starts to fall, those leveraged long traders can quickly run into trouble.
Here’s why:
Leverage amplifies both gains and losses.
If the price drops just a few percent, many traders’ margin (their own money in the trade) can’t cover the losses.
Exchanges then automatically liquidate (force-close) those trades to protect against further loss.
This is called a liquidation event, and it can cause a wave of automatic selling, pushing the price down even more.
The Commodity Futures Trading Commission (CFTC) explains this as part of how futures and margin markets keep risk in check.
Prediction:
If Bitcoin drops below $40,000, it could trigger a “long squeeze.”
As prices fall, liquidations start, one after another, creating a chain reaction that forces even more selling. This is sometimes called a liquidation cascade.
The result? A small dip can quickly turn into a sharp, fast drop, not because of new sellers, but because existing leveraged traders are being forced out.
A trader who sees this setup might:
Take profits on their long position before the drop starts, or
Wait for the squeeze to play out and look for a new entry point once the market settles.
More experienced traders might even consider a short trade (betting on the price going down), but only with careful risk controls.
Your Simple Guide to Using OI (Start Today!)
Ready to start using Open Interest (OI) in your trading?
Good news - you don’t need to be an expert. Here’s a simple, beginner-friendly plan to help you get started right away.
1. Just Watch and Learn
Before trading based on OI, take a few days to just observe. Pick one or two coins you already follow (like Bitcoin or Ethereum) and open their Open Interest charts.
Now, place the price chart right beside it. Watch how both move together.
Ask yourself:
Does OI go up when the price rises?
Does it drop when the price falls?
This simple exercise helps you see the rhythm of the market. You’ll quickly notice patterns that even advanced traders rely on.
The CME Group’s futures education center explains this as “watching participation and conviction,” which is exactly what you’re doing here.
2. Focus on the Big Moves
Don’t get distracted by small, daily wiggles in OI.
Instead, look for big jumps or sharp drops. These are the real signals.
When OI spikes higher, it means traders are opening lots of new positions, often just before a big price move.
When OI falls sharply, it means positions are being closed, sometimes right before the market cools off or reverses.
It’s a reminder that big OI moves = big market moments.
3. Check the “Mood” with Funding Rates
For perpetual futures, the Funding Rate shows the market’s mood, kind of like a sentiment meter.
When funding is highly positive, it means long traders are paying short traders - the crowd is too bullish, and prices may soon drop.
When funding is highly negative, it means shorts are paying longs - the crowd is too bearish, and a bounce could be coming.
Think of this as the market’s “emotional check.”
If you see high OI and an extreme funding rate (either too positive or too negative), the market is overstretched, like a rubber band ready to snap.
4. Know Where the “Danger Zones” Are
When lots of leveraged positions build up around certain price levels, those levels become danger zones, points where liquidations can trigger quickly.
Websites like CanHav help you spot these zones.
If the price drops below one of these key levels, it can trigger a liquidation domino effect, pushing prices down fast.
If it breaks above resistance, short positions may get liquidated instead, fueling a quick price rally.
These zones act like support and resistance levels, but powered by leverage.
5. Don’t Use OI Alone
OI is powerful, but it’s not magic. It works best when combined with other indicators you already know.
Use OI to confirm what other tools (like RSI, MACD, or trend lines) are telling you.
You can explore how professional traders blend OI with other tools in the Federal Reserve’s research on market behavior.
The key idea: OI gives context, not complete answers.
The Golden Rule: High OI = High Volatility
Whenever you see record-high OI, treat it as a warning sign.
It means lots of leverage is in play, and the market is primed for a big move, either up or down.
Even professional traders emphasize this. Stay disciplined, stay small, and protect your capital first.
Ready to Put Your New OI Knowledge to Work?
You’ve just learned how to read one of the most powerful indicators in crypto trading — Open Interest (OI).
That’s a big step forward in understanding how markets really move.
But here’s the thing: knowing what OI is is only the first step.
The real skill comes from knowing when and how to use it to make smarter trading decisions.
If you take the time to watch OI alongside price, you’ll start to see what professional traders look at every day - the balance between fear, greed, and leverage in the market.
At CanHav Crypto Research, we make complex crypto data simple and usable.
Our mission is to help new and growing traders cut through the noise and see what truly drives price action.
We turn that data into clear insights and actionable trade ideas, so you can focus on trading, not guessing.
Subscribe to CanHav Crypto Research today to:
See OI changes and funding rates across exchanges,
Get alerts on potential liquidation zones, and
Turn raw market data into a real trading edge.
Start small, stay consistent, and let data guide you.