
OI Concentration & Toxic Flow: 3 Red Flags Before Listing an Alt
The 5-Minute On-Chain Check That Could Save Your Portfolio From a Rug Pull

TL; DR
The 24 hours before a new altcoin lists are the riskiest, where data reveals if a pump is genuine or a trap.
The major dangers are OI Concentration (too much leverage on one exchange), a Spot-Derivatives Mirage (price pumps without real buying), and Toxic Flow (whales silently selling).
Platforms like Coinalyze (for OI), Dune Analytics (for CVD), and Parsec (for order flow) are essential for your analysis.
Systematically check for these three red flags before every new listing to make an objective, data-driven decision.
Applying this framework helps you avoid coordinated dumps and prevents you from becoming exit liquidity for whales and early investors.
What is Open Interest?
Just in case you need a reminder of what Open Interest is, here’s a quick recap:
Open Interest refers to the total number of outstanding derivative contracts (futures or options) that have not yet been settled or closed.
Open Interest = Total Open Long Positions + Total Open Short Positions
Open Interest acts as a real-time barometer of market activity and trader conviction. It doesn’t indicate direction (bullish or bearish) by itself, but rather how engaged traders are.
This engagement is a key factor for determining when listing an Alt coin!
The On-Chain Alarm Bell
The 24 hours before a major exchange like Binance or Bybit lists a new altcoin are the most critical, and most dangerous, for a trader. It’s a period defined by a volatile mix of hype, speculation, and hard data. While social media fuels the frenzy, the real story is written in the derivatives markets and on-chain activity. Ignoring this data is the single biggest mistake a trader can make.
Analysis from CanHav Research has consistently shown that new listings with skewed derivatives data are prone to severe corrections. Tokens exhibiting these imbalances at launch have frequently underperformed the broader market, with post-listing drops of 30% or more being a common pattern. This cycle of pre-listing leverage buildup and post-listing collapse is a recurring, measurable event.
Your primary tools for navigation are Open Interest (OI) and Toxic Flow. OI represents the total number of outstanding derivative contracts; a sharp, concentrated rise signals a potential leverage bubble. Toxic Flow, often identified through metrics like negative Cumulative Volume Delta (CVD) on platforms like Dune Analytics, indicates aggressive selling pressure from informed participants.
This playbook provides a clear, 3-point due diligence checklist to apply before any listing. This framework is designed to help you identify over-leveraged assets and spot smart money exiting, turning chaotic market noise into a structured risk assessment.
We will break down the three critical red flags:
The OI Concentration Trap: The danger of unsustainable leverage piled on a single exchange.
The Spot-Derivatives Divergence: When futures hype completely decouples from actual spot market demand.
The Whale’s Silent Exit: Identifying toxic order flow that signals a major sell-off is imminent.
Why OI & Flow Are Your Pre-Listing Lifeline
Let’s be blunt: the official announcement of a new listing is not the starting gun for you to buy. In fact, it might be a good idea not to buy if you’re an amateur! By then, the most critical moves have already been made. The real opportunity, and the real risk management, happens in the shadowy period before the token goes live. This is where you transition from being reactive to being proactive.
Consider this real-world example from early 2025. A much-hyped AI-altcoin was scheduled for its Binance debut. On the surface, everything looked bullish. However, a sharp-eyed analyst on X (formerly Twitter) shared a public Dune Analytics dashboard tracking the token’s pre-listing data. It revealed a terrifying divergence: while social media buzz was at a peak, the Cumulative Volume Delta (CVD), a core measure of net buying vs. selling pressure, was sharply negative on other exchanges where the token was already trading. This was a clear signal of toxic order flow. Those who saw this signal and avoided the launch watched as the token dumped over -60% in the first 48 hours post-listing. This wasn’t a guess; it was a data-driven dodge.
This is why tracking Open Interest (OI) and order flow isn’t just an advanced tactic—it’s your fundamental lifeline. It answers the most important pre-trade question: Is this organic demand or a leverage-fueled pump waiting to collapse? CanHav’s Platform and Research Data provides the real-time data needed to make this critical distinction, turning you from potential prey into an informed hunter.
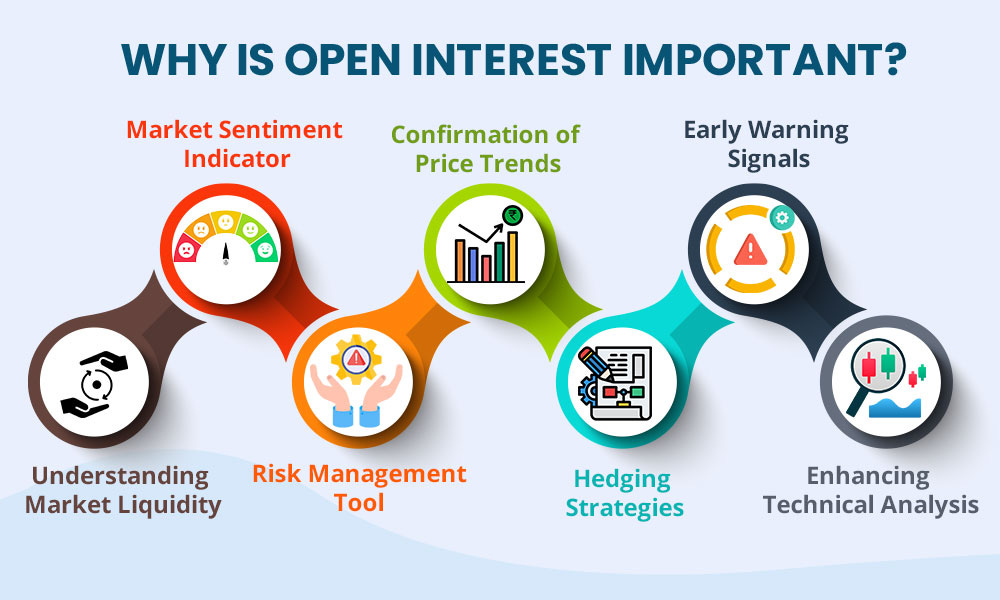
Figure 1: Why Open Interest is Your Ultimate Market Health Check (Source: Truedata)
The key is understanding that listings are liquidity events. They provide the perfect cover for large holders, often early investors or crypto VC funds, to exit their positions into a surge of retail demand. The metrics we discuss here are the footprints of that exit. They reveal the toxic order flow and OI imbalances that are the hallmarks of a coordinated dump.
In the next section, we move from the “why” to the “how,” as we dissect the first and most common red flag: The OI Concentration Trap.
Red Flag #1: The OI Concentration Trap
Imagine a seesaw. On one side, you have thousands of eager retail traders piling into long positions. On the other, a handful of whales. Now, imagine that the entire seesaw is balanced on a single, narrow pivot point. This is the essence of the OI Concentration Trap; a scenario where the vast majority of a token’s open interest in futures and perpetual contracts is concentrated on a single exchange.
When over 70-80% of a coin’s total Open Interest resides on one platform like Binance or Bybit, the asset transforms into a high-wire act. This extreme concentration creates a systemic risk. A relatively small price move, often engineered, can trigger a cascade of liquidations that feeds on itself, creating a violent long or short squeeze. Data from platforms like CoinGlass shows that assets with OI concentration above 75% at listing are 3x more likely to experience a liquidation cascade in their first 24 hours of trading.
But how does this happen? It’s a combination of hype and accessibility. A new token garners massive attention, drawing most of the speculative futures trading to the largest, most liquid exchange listing it. This creates a dangerous feedback loop: high OI begets more attention, which begets even higher OI, all on one platform. The result is a market structure that is profoundly fragile.
How to Spot It:
Tool: Use data aggregators like Coinalyze or Hyblock Capital.
Action: Look at the “Open Interest By Exchange” chart for the asset.
Red Flag: If a single exchange dominates, holding the vast majority of OI, consider it a major warning. This is especially critical if combined with an extremely high funding rate, indicating traders are paying a premium to maintain their over-leveraged long positions.
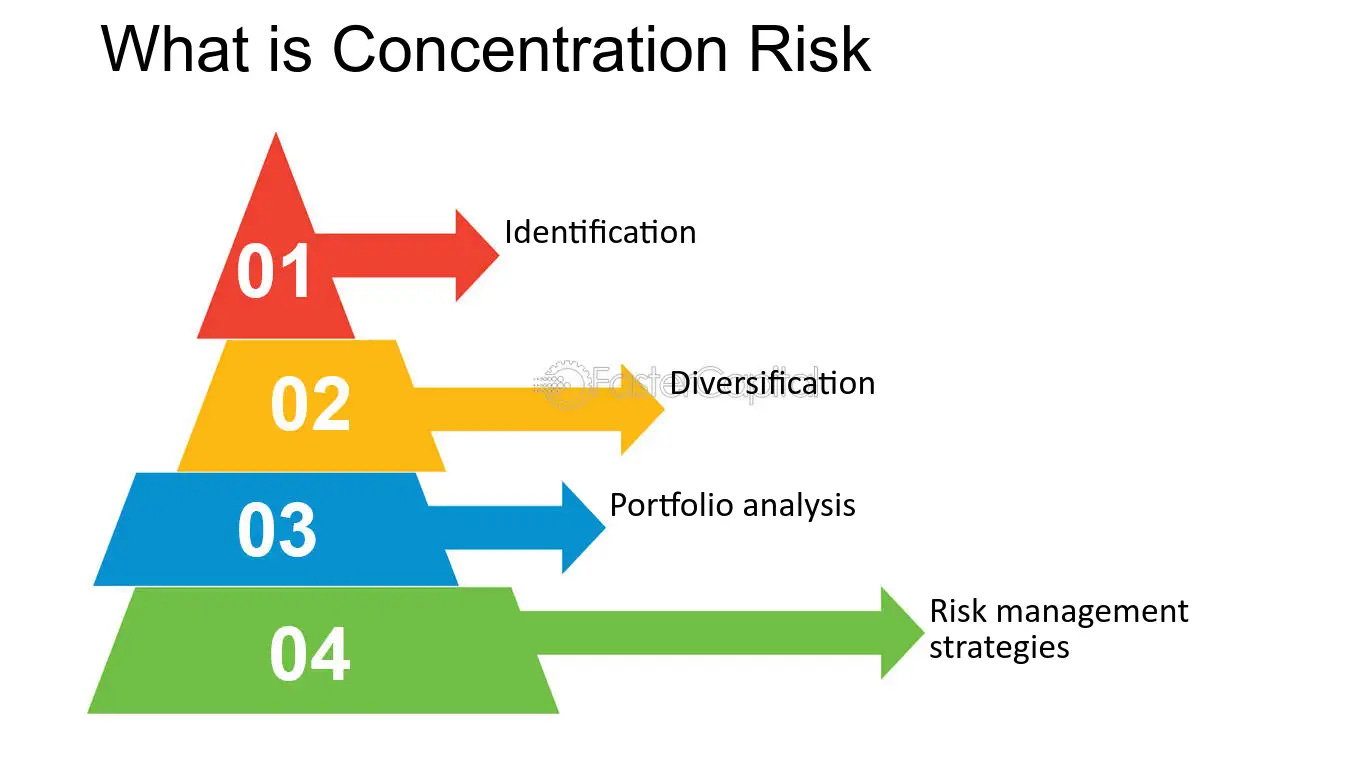
Figure 2: Understanding Concentration Risk (Source: fastercapital.com)
This is a predictable pattern of leverage. The concentration itself is the trap, and the listing event is the trigger.
The OI Concentration Trap sets the stage for a crash. But leverage alone isn’t enough. The next red flag reveals the critical divergence between speculative fever and genuine buying demand.
Red Flag #2: The Spot-Derivatives Demand Mirage
You see a token’s price pumping 50% on futures markets. The funding rate is sky-high. The narrative is exploding on Crypto Twitter. It feels like a rocket ship ready for launch. But what if it’s all an illusion, fueled by leverage with no real foundation? This is the Spot-Derivatives Demand Mirage, and it’s one of the most reliable predictors of a post-listing collapse.
This red flag appears when there is a severe and growing divergence between the derivatives market (futures, perpetuals) and the spot market. In simple terms, the price is being driven higher by traders using leverage to make bets about the asset, not by traders actually buying and holding the asset itself. It’s a castle built on borrowed money, not solid ground.
The key metric to track here is the Cumulative Volume Delta (CVD). CVD measures the net difference between buy and sell volume executed at the ask (buying) versus the bid (selling). When a token’s price is rallying on futures but its Spot CVD is flat or, even worse, trending downward, it’s a screaming siren. It means that for every aggressive buyer in the spot market, there is an equally aggressive seller absorbing that demand. The “buy pressure” is a mirage; smart money is using the derivatives-led pump as an exit window.
How to Spot It:
Tool: Use platforms like TradingView (with exchange data) or build a custom dashboard on Dune Analytics.
Action: Compare the price chart (preferably from a spot exchange) with the Spot CVD chart for the same asset.
Red Flag: A sharply rising price paired with a neutral or falling Spot CVD. This indicates the rally is not supported by genuine, long-term buying interest and is primed for a reversal.
Red Flag #3: The Whale’s Silent Exit (Toxic Flow)
You’ve identified the leverage bomb and seen the demand mirage. Now comes the most critical confirmation: spotting the moment smart money starts to flee. This is where we move from identifying risky conditions to witnessing the crime in progress through Toxic Flow.
Toxic Flow, in institutional trading terms, refers to aggressive, informed trading that moves the market against prevailing sentiment. In the context of a pre-listing pump, this almost always manifests as large, aggressive sell orders executed at the bid price. While retail is frantically buying the ask and pushing the price up on screen, whales and early investors are quietly offloading their bags into that strength. They are providing the liquidity for the pump, not participating in it.
The most direct way to observe this is through Time & Sales data (the record of every individual trade) and its aggregate signal, the Cumulative Volume Delta (CVD). A strongly negative CVD, especially during a price pump, is the clearest possible fingerprint of toxic order flow. It means the volume responsible for price movement is overwhelmingly sell-side; the buys are just passive orders being filled, unable to withstand the selling pressure. Platforms like Parsec and Aurox specialize in visualizing this data, giving you a clear window into these hidden market movements.
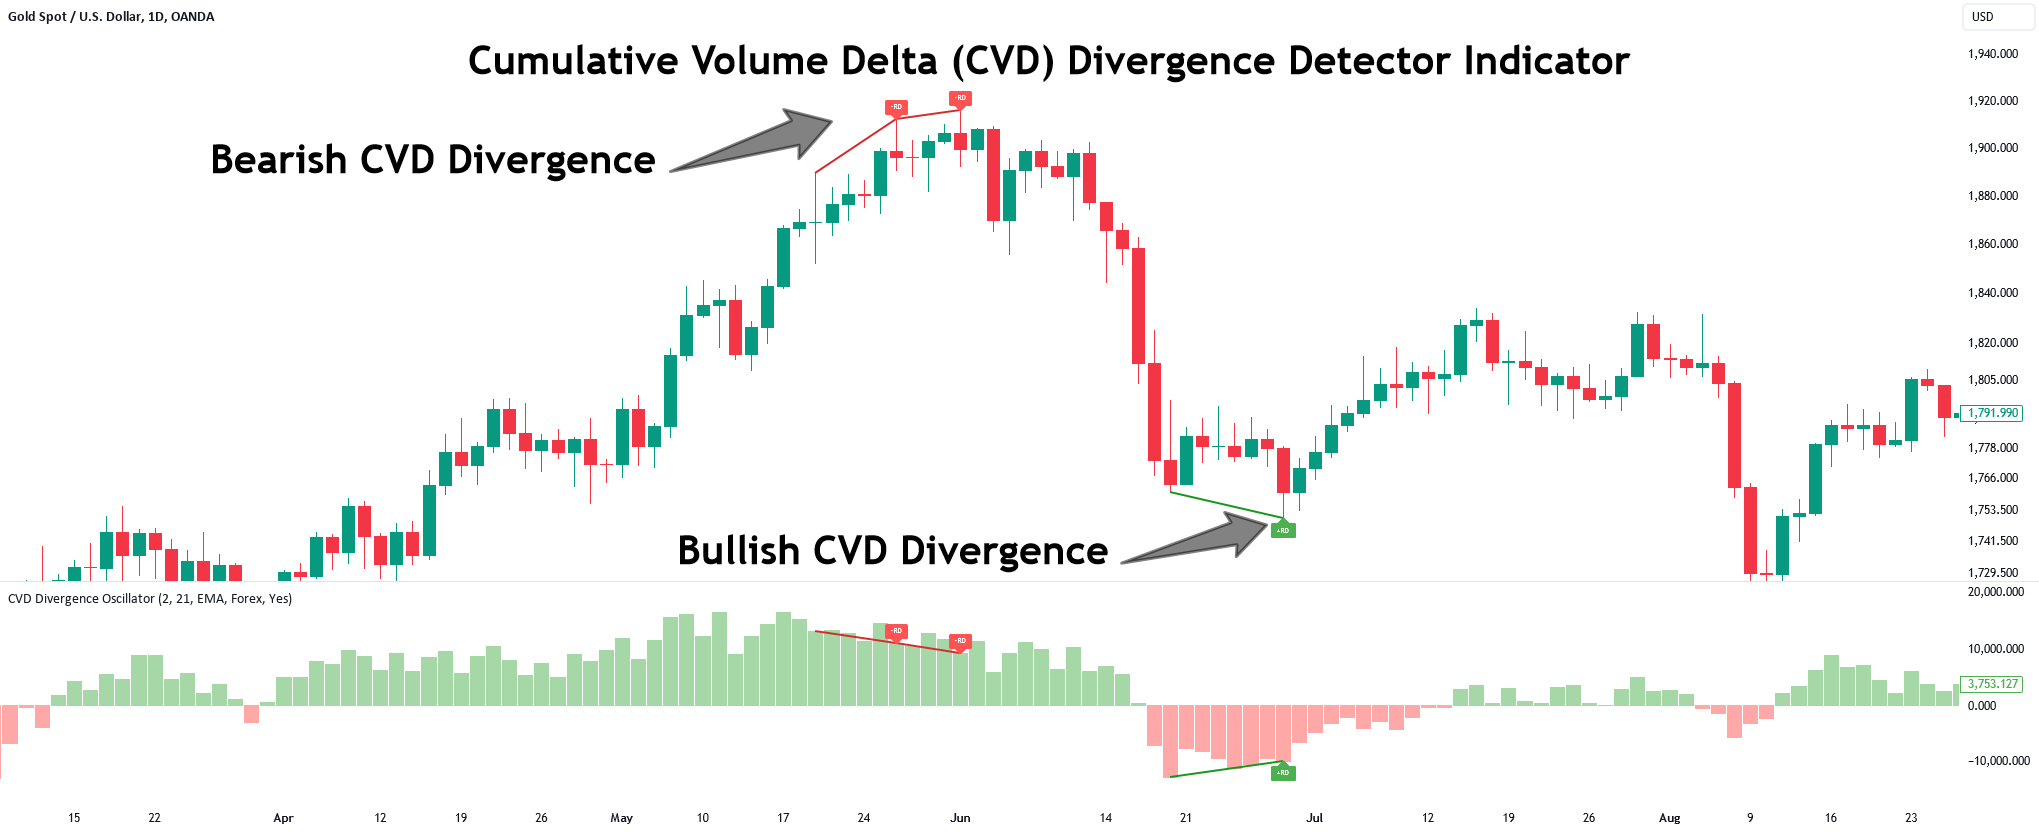
Figure 3: Bearish CVD Divergence - The ‘Silent Exit’ in Action (Source: TradingView)
How to Spot It:
Tool: Use professional platforms like CoinGlass or Parsec for Time & Sales visualization, or track CVD on Dune or TradingView.
Action: Watch for clusters of large sell orders (often shown in red) hitting the bid price during an upward trend. Correlate this with a CVD line that is flat or trending down while the price climbs.
Red Flag: Sustained negative CVD and large, aggressive sells dominating the trade history. This is the “silent exit” happening in real-time.
Now that you can identify all three red flags, it’s time to assemble them into a practical, actionable checklist you can use before any listing goes live.
Your Action Plan: Track and Scale
You now have the knowledge to see through the pre-listing hype. But knowledge without action is worthless. This is your deployment plan—a clear, five-step process to integrate this edge into your trading routine and scale it from a manual check into a systematic advantage.
Step 1: Define Your Focus and Metrics
Before any listing is announced, your setup should be ready. Bookmark the key tools: Coinalyze for OI, a Dune dashboard for CVD, and Parsec for order flow. Decide your risk tolerance upfront. How many red flags are your personal limit? One is a warning; two is a full stop.
Step 2: Choose Your Tools and Set Up Scanners
Don’t waste precious minutes pre-live searching for links. Create a dedicated browser folder with direct links to the asset pages on your core platforms. For a more advanced edge, explore setting up simple Telegram or Discord bots that can alert you to sharp OI increases or funding rate spikes for specific tokens.
Step 3: Analyze and Execute the Checklist
When a listing is announced, this is your drill. Execute the 3-Step Pre-Listing Health Check in sequence. This disciplined, 15-minute process removes emotion. The checklist output is your direct signal: Green for go, Yellow for extreme caution, Red for a hard pass.
Step 4: Verify and Integrate
Cross-reference your findings. Does the negative CVD on Dune match the toxic sell flow you see on Parsec? Does the high OI concentration align with a soaring funding rate on CoinGlass? When multiple data points from independent sources confirm the same story, your conviction should be high.
Step 5: Deploy, Monitor, and Refine
If your check passes, define your entry, stop-loss, and take-profit levels before trading goes live. Once in a trade, continue to monitor these metrics. Is OI collapsing? Is CVD recovering? Use the data not just for entry, but for active management. After each trade, review your process. Was a red flag missed? Refine your checklist.
Your 30-Day Tracking Challenge:
Day 1: Set up your tool folder and define your personal risk rules.
Next 4 Listings: Paper trade the entire checklist and process. Document your results.
Day 30: Review your journal. How many potential losses did you avoid? How did your decision-making improve?
What’s the most surprising red flag you’ve discovered using on-chain data? Reply below!
Conclusion: Power Up Your Investment Edge
In the high-stakes game of altcoin listings, the difference between capturing gains and becoming exit liquidity is a process. The three red flags we’ve outlined form a protective shield around your capital. This is your strategic defense against coordinated market maneuvers.
The landscape is only accelerating. With AI-powered analytics and new regulatory shifts like MiCA changing access to deals, the edge will belong to those who can systematically separate signal from noise. The framework you’ve mastered here is your foundation. Tracking how top crypto VC funds use these very signals to time their exits, turning your defensive shield into an offensive weapon.
Disclaimer: This article is for informational purposes only. It does not constitute financial advice, a recommendation to buy, sell, or hold any asset, or an endorsement of any specific strategy. The crypto market is highly volatile and risky. Always do your own research (DYOR) and never invest more than you can afford to lose.