
Decoding Long/Short Ratio: How to Read Market Positioning Like a Pro (with analysis templates inside)
Learn how the long/short ratio reveals what traders really feel, and how you can read market emotions before making your first trade.


TL; DR
The long/short ratio shows how traders are positioned; how many are betting on prices to rise versus fall. But more importantly, it reveals how confident or fearful the market really is.
When too many traders are on one side (all long or all short), the market becomes fragile, and even small moves can trigger liquidations.
For beginners, the long/short ratio isn’t a trading signal but a learning lens. It helps you see the market’s emotional temperature and understand crowd behavior before you ever place a trade.
By watching how the ratio shifts during rallies and crashes, you start to recognize that markets don’t move on logic alone, they move on collective conviction, and sometimes, collective overconfidence.
How Trader Positioning Creates Market Fragility
Every trader, no matter how experienced, begins by trying to answer the same question: “What are other people doing?”
In crypto markets, that question matters even more because the market moves fast, driven not just by price, but by crowd behaviour. Before you ever place your first trade, it’s important to learn how to read the room. And one of the best tools for that is something called the long/short ratio.
At first glance, it looks simple; a number showing how many traders think prices will go up (longs) versus down (shorts). But underneath that simplicity is a powerful story about belief, risk, and emotion. Understanding this ratio is your first real window into how the market feels, not just what it’s doing.
This article will walk you through what the long/short ratio means, why it matters in your trading strategy, and how you can use it to start thinking like a trader, even before you become one.
What the Long/Short Ratio Actually Is
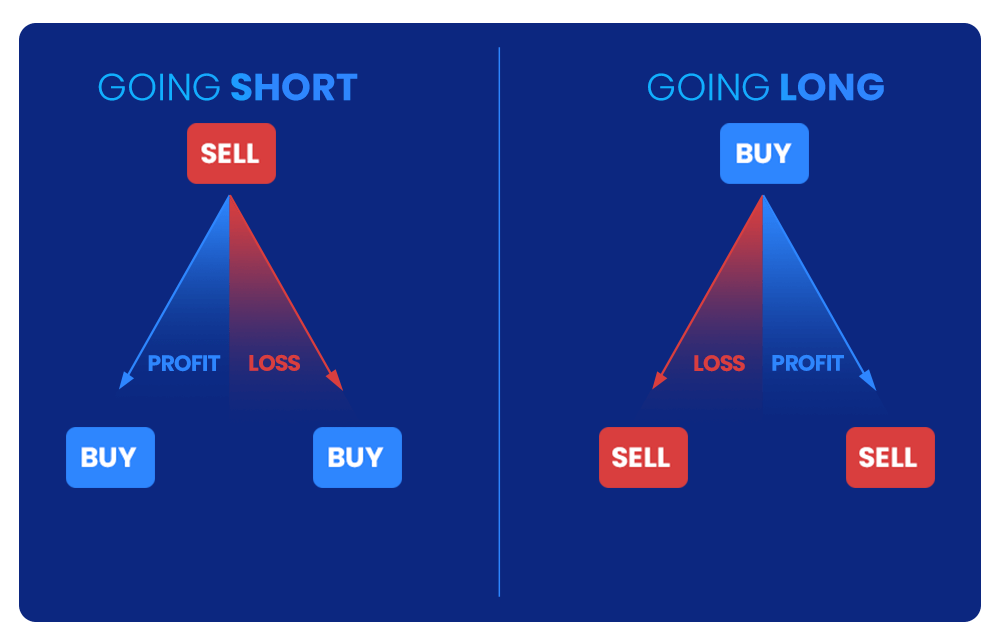
Let’s start with the basics. In crypto derivatives (like perpetual futures), you can take two kinds of positions:
Long positions, where traders bet the price will go up.
Short positions, where they bet the price will go down.
The long/short ratio shows how many traders are on each side. If the ratio is 2.0, it means there are twice as many long traders as short traders. If it’s 0.5, it means there are twice as many shorts as longs.
It’s that simple, but what makes this number important isn’t the math; it’s the psychology behind it. As explained in the context of how trader positioning works in crypto: when most traders are long, it usually means the crowd is feeling confident or greedy. When most are short, it means fear or doubt is dominating. The long/short ratio is like a market mood tracker, a quick way to sense whether the majority believes prices are going higher or lower.
For a beginner, this is your first tool for seeing how “the crowd” behaves and understanding that markets aren’t just numbers; they’re emotions in motion.
Why It Matters (Even Before You Start Trading)
You might not be trading yet, and that’s fine. In fact, it’s an advantage. Because learning to interpret the long/short ratio before you have skin in the game teaches you the most important lesson in trading: Markets move because people overcommit emotionally.
In derivatives, where leverage magnifies exposure, crowd positioning becomes a ticking time bomb.
If everyone’s long, prices don’t need to drop much for liquidation triggers to start a long squeeze, a fast cascade of selling that pushes prices down even harder.
If everyone’s short, a small uptick can ignite a short squeeze, where forced buying pushes prices up violently. This dynamic is clearly illustrated when you track open interest and funding rates analysis alongside the ratio.
The lesson? When the long/short ratio leans too far to one side, it’s not about predicting direction, it’s about recognizing where risk is concentrated.
Professional traders don’t ask “who’s right?” They ask “who’s overexposed?”
How to Interpret It Like a Professional Thinker
The ratio itself is useful, but the change over time is where the real insight lives. Think of it as watching market emotion evolve.
For example:
If the ratio slowly rises over several days while prices stay flat, it means more traders are going long but the market isn’t following - a sign of overconfidence.
If the ratio drops sharply after a big dip, it means traders are rushing to short - a sign of fear or capitulation.
If the ratio stays balanced (around 1.0), it means the market is uncertain - no one’s sure what comes next.
By watching these shifts, you’ll start to recognize recurring emotional cycles:
1. Confidence
2. Greed
3. Panic
4. Exhaustion
5. Recovery
This framing aligns with sentiment-driven trading strategies like the one described in sentiment-driven trading strategies.
This is the invisible heartbeat of every market. Understanding it early gives you a map of crowd emotion, and that’s how professionals stay one step ahead.
The Emotional Cycle Hidden in the Data
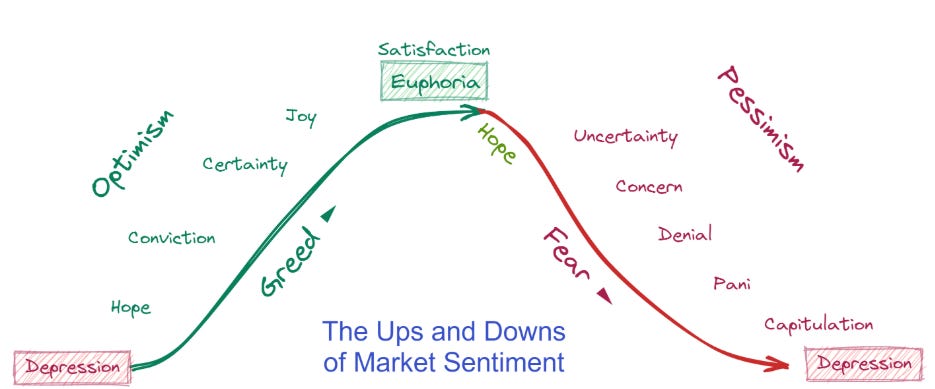
Every market, whether it’s Bitcoin or Solana, follows the same emotional loop.
Optimism: Price rises, ratio climbs moderately. Traders join in confidently.
Euphoria: Ratio surges > 2.0. Everyone’s long. “It can’t go down.”
Reality Check: Price stalls. Leverage builds. A small dip triggers liquidations.
Panic: Ratio collapses. Traders rush to short.
Capitulation: Shorts overcrowd. Fear peaks.
Recovery: Market stabilises, and early contrarians buy back in quietly.
Learning to spot where the market sits on this emotional curve is one of the most valuable habits you can build.
Mini-example: In mid-April 2021, Bitcoin (BTC) reached a peak near $64,800 on April 14. At the same time, aggregated long/short ratio metrics from futures markets showed long positions significantly dominating short positions, the ratio was well above 1.0, indicating growing crowd bullishness.
Within days of these extremes, a sharp correction followed. The sentiment had already peaked before prices rolled over. That underlines the lesson: by the time everyone agrees, it’s already too late.
Your Beginner’s Analysis Step-by-Step Template
You don’t need to trade to think like a trader. Here’s a simple step-by-step framework you can use each week to analyse the ratio.
Step 1 - Observe the Ratio Daily
Go to a real-time platform and note whether the ratio is above, below, or near 1.0. Write it down.
Step 2 - Note the Price Trend
Look at Bitcoin’s (or your target asset’s) price. Is it rising, falling, or flat?
Step 3 - Compare Movement and Ratio
If price rises and the ratio rises too → crowd confidence is building.
If price rises but the ratio falls → some traders are exiting; sentiment is cautious.
Step 4 - Track Extremes
When the ratio goes above ~2.0 or below ~0.7, mark it. These are emotional zones. Watch what happens next. Often, within days, volatility follows.
Step 5 - Reflect on the Pattern
Ask: Was the crowd right? Or did the market move against them?
This simple reflection helps you train your intuition, something data alone can’t teach. Over time, you’ll start spotting recurring behaviours that feel familiar. That’s how professional traders build judgement, by watching before acting.
Common Beginner Misunderstandings
As you explore, you’ll notice some common traps new traders fall into:
“High ratio = bullish.”
Not always. It can mean everyone’s already long, and out of buying power.“Low ratio = bearish.”
Often means the opposite, crowd fear that sets up a rebound.“It’s a trading signal.”
It’s not. It’s a risk indicator. Use it to judge sentiment, not direction.“One exchange view is enough.”
Nope. Always cross-check multiple exchanges. Crowds differ.
Your goal isn’t to find certainty; it’s to develop awareness. Awareness is the real skill.
Why This Matters Before You Trade
The long/short ratio teaches you something essential before you even start trading: Markets move because people position themselves emotionally, not rationally.
By studying this ratio early, you’ll enter the trading world with an advantage most beginners don’t have, which is perspective. You’ll see that price is only the surface. Underneath it lies belief, leverage, and psychology.
Learning to read that invisible layer now will make every chart, every candle, and every market cycle make more sense later. You’ll start seeing patterns not as random chaos, but as human behaviour repeating itself.
Conclusion: Learning to Read the Crowd Before Joining It
If you haven’t started trading yet, you’re in the perfect spot. You can learn how markets think before you risk capital.
The long/short ratio is your first window into crowd psychology. Watch how sentiment builds and collapses, how greed turns to fear, and how leverage amplifies both.
Professional traders may use algorithms and quant dashboards, but at the core, they’re still reading one thing: the crowd.
Learn that skill early, and you’ll already be thinking like a pro long before you place your first trade.
Subscribe to CanHav on crypto trends, derivatives, stablecoin strategies, and on-chain finance. Get alerts on 2026 updates!
Disclaimer: This article is for informational purposes only. It does not constitute financial advice, a recommendation to buy, sell, or hold any asset, or an endorsement of any specific strategy. The crypto market is highly volatile and risky. Always do your own research (DYOR) and never invest more than you can afford to lose.