
CanHav’s Beginner Guide to Crypto Derivatives Metrics: Reading Market Signals Like a Pro
Crypto derivatives metrics reveal the mood, risk, and sentiment driving the market. When read in context, they show the forces behind every price move.

TL;DR
Crypto derivatives let traders speculate and manage risk without owning the underlying asset. Understanding their key metrics is essential to interpreting real market behavior.
Core indicators like Open Interest, Funding Rates, Volatility, and Basis uncover hidden layers of leverage, sentiment, and positioning beneath surface-level price action.
These metrics are deeply connected, showing where risk is building, where emotion is steering markets, and when conditions are shifting beneath the charts.
Reading them in context helps to anticipate moves, avoid emotional mistakes, and trade with insight instead of reacting to short-term price noise.
What Are Crypto Derivatives?
Crypto derivatives are contracts that track the price of a cryptocurrency, like Bitcoin or Ethereum, without requiring you to actually own it. Their value is derived from an underlying asset, which is where the name comes from.
Think of derivatives as tools for expressing a view on the market. Instead of buying Bitcoin directly, a trader can use a derivative to:
Speculate on whether the price will rise or fall.
Hedge against volatility and protect existing positions.
Earn income from small price differences between markets.
The three main types of crypto derivatives are:
Futures: Contracts to buy or sell crypto at a set price on a specific future date. Used to lock in prices or bet on future moves.
Perpetual Swaps: A crypto-native version of futures with no expiry date. They dominate derivatives trading thanks to 24/7 markets and built-in funding rates that keep prices close to spot levels.
Options: Contracts that give you the right, but not the obligation, to buy or sell at a certain price. Traders use them to hedge risk or profit from volatility.
At their core, derivatives exist to transfer risk, from those who want to reduce it to those willing to take it on.
Why Derivatives Metrics Matter in Crypto
Derivatives metrics are the pulse of the crypto market. They reveal what traders are thinking, how much risk they’re taking, and where capital is moving long before price action shows it.
Price tells you what happened. Derivatives metrics tell you why. They capture the invisible forces that drive markets such as leverage, positioning, and sentiment. When open interest in crypto markets rises, funding rates in crypto trading turn extreme, or liquidation risk spikes, those signals often appear before major price shifts.
For traders, understanding these data points means seeing beneath the surface. Instead of reacting to every price swing, you start anticipating what fuels them, the buildup and release of leverage.
Learning to read derivatives metrics gives you a clearer map of market behavior. It connects emotion to structure, risk to reward, and helps you trade with insight, not impulse.
1. Open Interest (OI): The Market’s Pressure Gauge
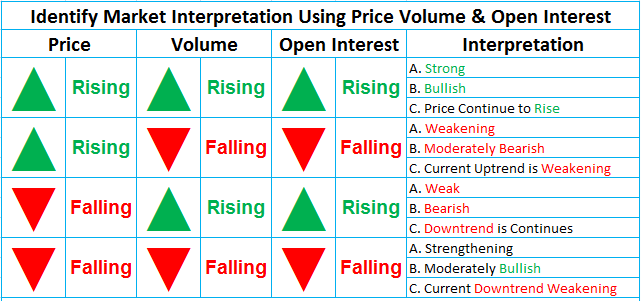
Open Interest (OI) tracks the total number of active futures or options contracts that haven’t been closed or settled. It shows how much open exposure exists, essentially, how many traders are participating in the market.
Rising OI means new positions and growing engagement, while falling OI signals traders exiting or taking profit. High OI reflects strong liquidity and active participation but also indicates more leverage, which can increase volatility. Low OI suggests thin markets that are easier to move.
OI connects to other metrics, when funding rates rise alongside OI, it signals aggressive leverage and possible liquidation cascades. A sharp OI drop after mass liquidations often marks a reset. In short, OI measures how much risk is active, while funding and liquidation data reveal how that risk behaves.
2. Funding Rates: The Market’s Sentiment Thermometer

Funding rates are small periodic payments between long and short traders in perpetual futures contracts. They keep contract prices close to the spot market, when perpetuals trade above spot, longs pay shorts (positive funding); when below, shorts pay longs (negative funding).
Beyond balancing prices, funding rates act as a real-time gauge of trader sentiment. Positive funding reflects optimism and risk-taking, while negative funding signals fear and defensive positioning. The more extreme the funding, the stronger the emotional bias driving the market.
Funding data becomes even more powerful when viewed alongside Open Interest and Liquidations. Rising OI with high positive funding often indicates crowded longs and elevated liquidation risk. Conversely, deeply negative funding during an OI drop shows panic, usually near market bottoms.
Together, these metrics form a sentiment map: OI measures participation, funding captures emotion, and liquidations reveal the outcome.
3. Liquidations: The Market’s Chain Reaction
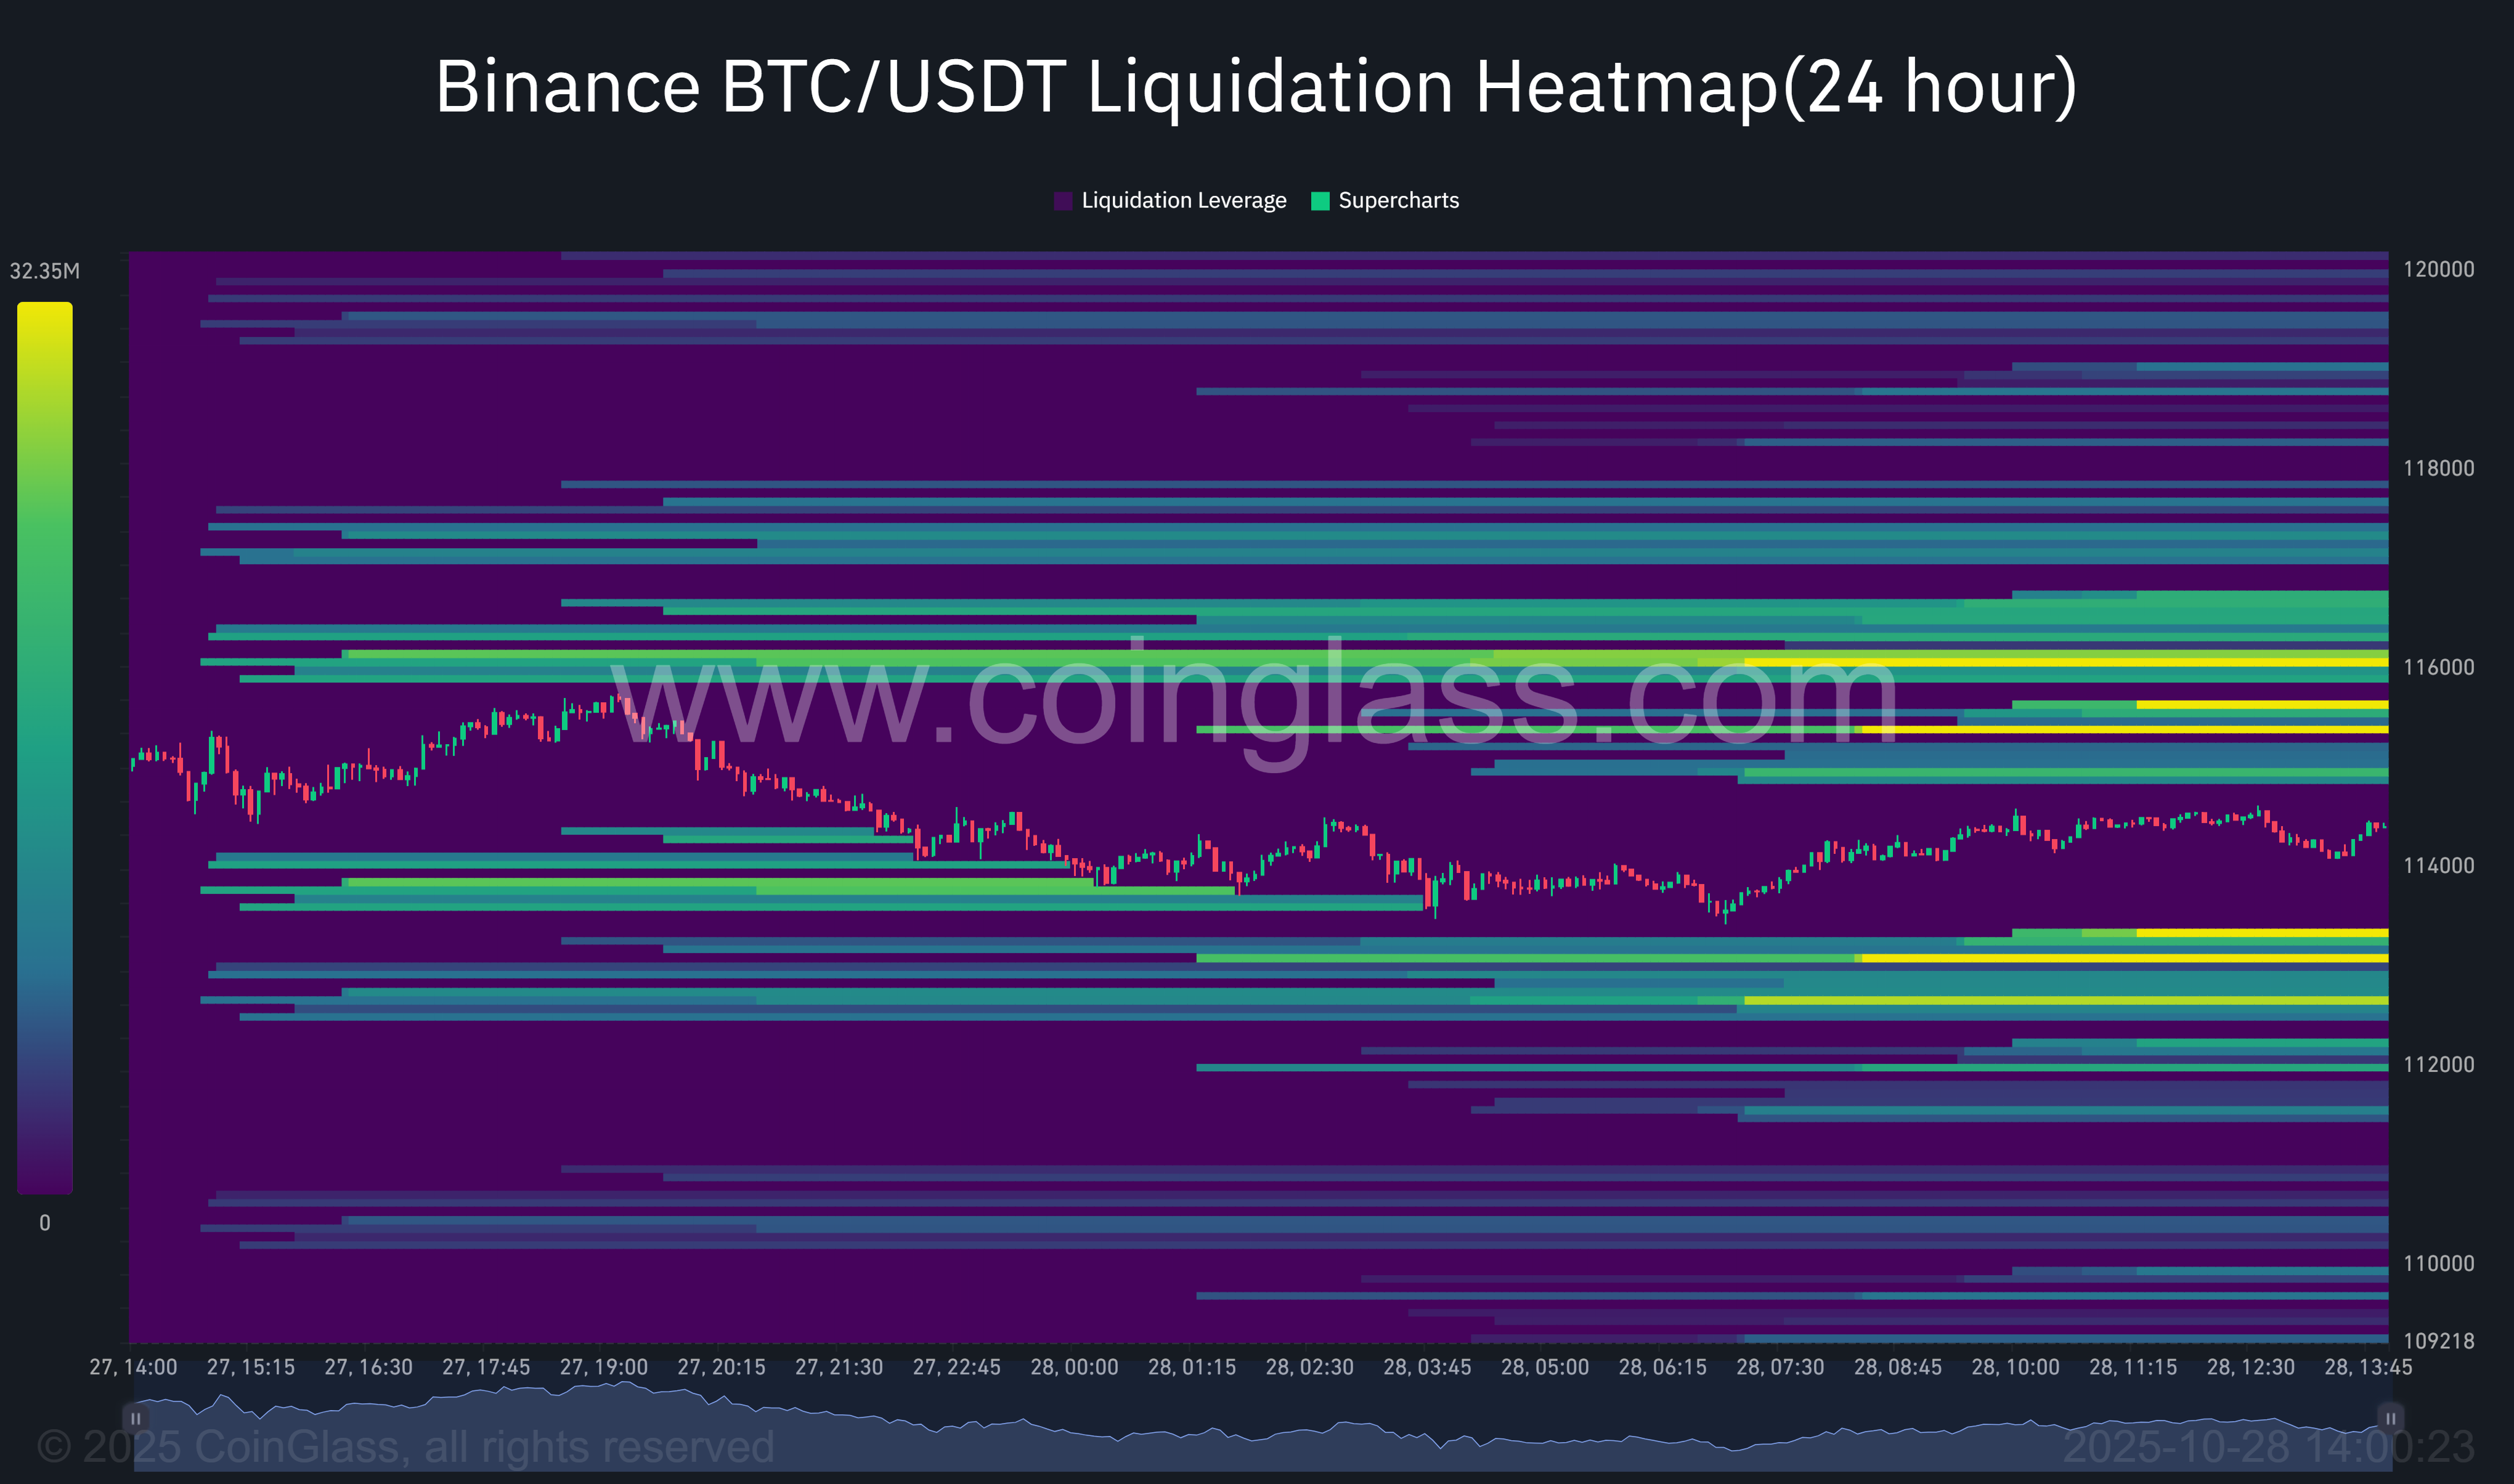
Liquidations occur when a trader’s margin falls too low and the exchange instantly closes their position. Unlike traditional markets, crypto offers no margin call, it’s automatic and unforgiving.
When many traders use similar leverage, a small price drop can trigger a liquidation cascade, forced sells that accelerate losses and drive prices lower.
These cascades make crypto crashes fast and violent but also act as a reset. Open Interest shows where leverage builds, Funding Rates show which side is crowded, and Liquidations reveal where that leverage breaks.
In May 2021, when Bitcoin fell from $58,000 to $50,000, over $8 billion in leveraged longs were wiped out in 24 hours, a purge that cleared excess risk and set the stage for recovery.
4. Volatility: The Market’s Energy Meter
Volatility measures how much and how fast prices move. In crypto, it’s amplified by leverage, liquidity, and emotion, making it both an opportunity and a risk.
High volatility: Wide price swings and breakout potential.
Low volatility: Calm before the storm, a sign of market compression.
There are two main types of volatility:
Realized Volatility: Actual past movement.
Implied Volatility (IV): Expected movement, based on options pricing.
When IV rises, traders anticipate turbulence. When it falls, complacency often grows. Volatility spikes tend to coincide with Open Interest buildups or liquidation events, marking emotional turning points in the market.
5. Basis (Futures Premium or Discount): Reading Market Expectations
The basis is the gap between a crypto asset’s futures price and its spot price.
When futures trade above spot (contango), it signals optimism and strong demand for longs.
When they trade below spot (backwardation), it reflects fear or defensive positioning.
In short, the basis shows what traders expect prices to do, and how much they’ll pay or accept to express that view.
A rising positive basis usually appears in bullish markets, while a shrinking or negative basis signals caution. When Funding Rates and Open Interest rise alongside a strong basis, it often means crowded longs and a market ripe for correction.
Conversely, a flat or negative basis with falling OI and funding suggests traders are de-risking, often near market exhaustion. The basis is a forward-looking sentiment gauge, it shows when confidence stretches too far, and when opportunity quietly returns.
6. Options Metrics: Reading Fear, Confidence, and Volatility Expectations
Options metrics like Implied Volatility (IV), skew, and put/call ratio help traders measure crowd psychology and future risk expectations.
High IV: Markets expect large swings.
Low IV: Calm or complacency.
High put/call ratio: Fear and downside hedging.
Low ratio: Optimism and speculative activity.
A spike in IV with rising OI often signals traders bracing for turbulence, typically near key announcements or turning points.
Options metrics link closely with Volatility, Funding Rates, and Open Interest. Rising IV alongside high OI shows traders bracing for turbulence, often near major announcements or market turning points.
A heavy bias toward puts reflects fear-driven hedging, while surging call demand with positive funding shows greed or overconfidence. Monitoring options sentiment helps traders read emotional extremes before they appear in price action, turning what looks like noise into a clear map of crowd psychology.
7. Market Sentiment and External Factors: The Forces Behind the Metrics
Market sentiment is the emotion behind every trade — the mix of fear, greed, confidence, and uncertainty that drives behavior. It shapes all key metrics:
In optimistic markets, funding turns positive, Open Interest expands, and Basis widens as traders take on more leverage.
During fearful periods, funding flips negative, OI contracts, and Volatility spikes as traders hedge or exit risk.
Social media trends, headlines, and crowd reactions often amplify these emotional swings long before fundamentals catch up.
Sentiment also reacts to external forces.
Macro factors like rising rates or inflation fears cool leverage and compress OI.
Regulatory clarity or technological upgrades, such as ETF approvals or on-chain derivatives innovation, can restore confidence and reignite risk-taking.
For traders, the key is seeing how these forces ripple through OI, Funding, Volatility, and Options Metrics. It’s not just about numbers, it’s about recognizing when the market’s mood shifts and momentum changes with it.
Broader Market Factors That Influence Derivatives Metrics
Even though derivatives metrics reveal market structure and sentiment, they don’t move in isolation. They react to larger forces shaping the entire crypto ecosystem. Understanding these underlying factors gives traders deeper context for what drives changes in open interest, funding, and volatility.
Underlying Price
The spot market price of an asset is the foundation of every derivative. Futures, perpetuals, and options all derive their value from it. When the spot price moves sharply, it instantly impacts funding rates, liquidation levels, and basis spreads. Derivatives follow the spot market’s lead, magnifying moves but rarely initiating them.
Supply and Demand
Market demand determines how much leverage traders use and how wide basis spreads get. Strong institutional inflows or increased capital in crypto exchanges drive higher open interest and tighter spreads. On the other hand, outflows or reduced liquidity lead to thinning markets, higher volatility, and wider funding swings.
Regulations
Legal clarity or uncertainty directly affects participation. Clear frameworks, like futures approvals or regulated derivatives exchanges, invite institutions, boosting open interest and liquidity. Conversely, restrictive policies or leverage caps reduce speculative activity, often calming volatility but lowering volume.
Economic Conditions
Macroeconomic events like inflation, interest rates, and liquidity cycles ripple through the crypto derivatives market. Rising rates make leverage more expensive, flattening basis and reducing OI. Conversely, looser monetary policy and investor risk appetite expand leverage and widen spreads.
Technological Factors
Upgrades in blockchain infrastructure, such as Ethereum’s shift to proof-of-stake or layer-2 scaling, change how traders use leverage and collateral. New DeFi derivatives platforms also increase access, reshaping where and how risk accumulates.
Arbitrage and Leverage
Professional traders exploit inefficiencies between spot and derivatives prices. These arbitrage flows help keep markets aligned but can also introduce short-term volatility when funding or basis diverges across exchanges. High leverage amplifies these effects, making the system more sensitive to small price moves.
Common Mistakes When Reading Derivatives Data
Many traders focus on a single data point without understanding the context that gives it meaning. Recognizing these common mistakes helps you avoid emotional trades and false signals.
1. Reading OI Without Context
A rise in Open Interest doesn’t always mean new bullish positions. It can also reflect aggressive shorting or hedging activity. Always compare OI changes with price direction and funding rates to see which side of the market is building exposure.
2. Ignoring Funding Rate Extremes
Funding rates can flip quickly. Positive funding doesn’t automatically mean strength. It can also mean overcrowded longs ripe for a squeeze. Likewise, negative funding isn’t always bearish; it often signals fear near bottoms.
3. Overreacting to Liquidation Events
Large liquidations look dramatic but often mark the end of a move, not the start. Traders who panic during liquidation cascades often sell into bottoms or buy into tops. Wait for OI resets and funding normalization before drawing conclusions.
4. Confusing Volatility With Trend
High volatility doesn’t guarantee a breakout. It simply means the market is moving fast. Look for direction confirmed by OI and funding. Volatility without participation usually fades quickly.
5. Ignoring Macro and Sentiment Shifts
Derivatives metrics live inside a bigger picture. News events, regulation, or macro conditions can flip sentiment faster than data updates. Always blend technical signals with awareness of the broader market mood.
Conclusion: Seeing Beyond the Chart
Crypto derivatives are the language of market psychology written in data. Metrics like open interest, funding rates, and volatility don’t just show numbers, they show how risk, confidence, and emotion flow through the system. But no single metric stands alone. They all move in response to broader forces: spot prices, liquidity, regulation, and technology.
The more you connect these dots, the earlier you see stress building and opportunities forming. In the end, successful traders don’t just watch price action, they read the metrics that shape it.
Subscribe to CanHav on crypto trends, derivatives, stablecoin strategies, and on-chain finance. Get alerts on 2026 updates!
Disclaimer: This article is for informational purposes only. It does not constitute financial advice, a recommendation to buy, sell, or hold any asset, or an endorsement of any specific strategy. The crypto market is highly volatile and risky. Always do your own research (DYOR) and never invest more than you can afford to lose.